Within Hours: Deal Room Analytics for Buying Groups and RevOps

Deal room analytics are the engagement signals inside buyer-facing deal rooms that show which stakeholders are actually evaluating your offer and which assets predict a next step. They connect what a champion, a CFO, or a CISO does inside the room to real outcomes like meetings booked and deals won. Forrester frames this as a shift from tracking leads to tracking groups, and platforms like TrailerCast build their reporting around exactly that.
TL;DR:
- Deal room analytics must link asset performance directly to deal progress and buyer group engagement to avoid optimizing for popularity over actual pipeline movement.
- Tagging content by stage, persona, and objective is essential for accurate attribution, anonymous versus known viewers need different treatment, and forwarding signals reveal key secondary influencers.
- Dashboards should be tailored for specific roles, such as deal engagement for sales, asset impact for marketing, and misuse detection for RevOps, with reporting frequencies aligned to buying speed.
- Trigger rules based on deal stage and role involvement are critical for timely actions, such as alerting the sales team within a day on late-stage asset views without a next step.
- TrailerCast streamlines data stitching and offers integrated Decision Rooms with engagement tracking, attribution, and ranking features, eliminating the need for multiple point solutions.
Table of Contents
- What deal room analytics actually measure
- How to instrument deal rooms so the data can be trusted
- Which dashboards actually predict what happens next
- Turning signals into next-best actions
- What this looks like inside TrailerCast
- What CROs should actually prioritize here
- Where TrailerCast fits if you’re ready to act on this
- Sources
- FAQ
What deal room analytics actually measure
Most teams track one thing: did the prospect open the deck. That tells you almost nothing about whether a deal is moving. A useful measurement model works at three levels, and each one answers a different question.
Asset-level metrics tell you whether a piece of content is doing its job. Deal-level metrics tell you whether the right people are in the room. Outcome metrics tell you whether any of it is turning into revenue.
- Asset level: completion rate, percentage watched, repeat views, and time spent on a document or trailer.
- Deal level: stakeholder breadth (how many distinct people engaged), recency of activity, forwarding and attribution (who shared with whom), and whether a stakeholder consumed one asset or five.
- Outcome level: meetings booked, mutual-action-plan acceptance, stage progression, win rate, and cycle time.
The reason to separate these layers is simple: a trailer with hundreds of views looks like a hit, but if only one person ever watched it, you have an engaged individual, not an engaged buying group. Pedowitz Group’s measurement framework makes this point directly: without linking asset performance to deal and outcome data, you end up optimizing for popularity instead of pipeline. A security one-pager that gets opened once by a CISO and triggers a signature three days later is worth more than a case study that gets reopened ten times by the same champion and goes nowhere.
How to instrument deal rooms so the data can be trusted
Analytics are only as good as the tagging underneath them. Before you build a single dashboard, get the plumbing right.
- Build a content taxonomy by stage, persona, and objective: a discovery-stage ROI calculator for an economic buyer, a validation-stage security brief for a CISO, a decision-stage mutual action plan for the whole committee.
- Tag every asset in your library against that taxonomy so a trailer, PDF, or page can be matched to the right stage and role automatically.
- Use tracked links and known-viewer conversion points (a short form, an email click, a calendar booking) so anonymous traffic becomes attributable traffic.
- Log every meaningful event to the CRM timeline, not just a separate analytics tool, so sellers see engagement where they already work.
- Set UTM rules once and apply them consistently, so a forwarded link from a champion’s email is distinguishable from a cold inbound click.
- Decide how to treat anonymous viewers versus known viewers: count anonymous views as a group-level signal (someone looked), and known views as individual signal (this specific person looked, and for how long).
- Apply decay windows so a view from eight weeks ago carries less weight than one from yesterday, and keep a central mapping table tying content IDs to CRM deal records so reporting stays consistent across tools.
Forwarding deserves its own attention. When a champion sends a trailer to a CFO who was never on a call, that is not noise, it is the clearest buying-group signal you will get, and practical guidance on buyer engagement recommends mapping those forwarding trees to find secondary influencers.
Pro Tip: Build the taxonomy before you build the dashboard. A perfect dashboard on top of untagged content just produces a prettier version of the same confusion.
Which dashboards actually predict what happens next
Three dashboards cover almost everything a sales or RevOps leader needs, and each one answers a different question for a different audience.
- Deal engagement: stakeholder count, recency, stage fit, and time-to-next-step, built for AEs and sales managers who need to know which deals are quietly dying.
- Asset impact: which content correlates with stage progression and win rate, built for enablement and marketing, who need to know what to produce more of.
- Content misuse: wrong assets shown at the wrong stage, low completion rates, and stale decks still in rotation, built for RevOps, who owns the cleanup.
Pedowitz Group recommends testing asset impact with stage-controlled cohorts rather than raw totals, comparing deals at the same stage that did and did not engage with a given asset. That controls for the obvious trap: late-stage deals naturally have more engagement than early-stage ones, so a raw ranking will always favor bottom-of-funnel content regardless of whether it actually moved anything.
Reporting rhythm matters as much as the dashboards themselves. AEs should see deal engagement daily, inside their existing workflow. Enablement and marketing should review asset impact monthly. RevOps should own content misuse as an ongoing cleanup queue, reviewed biweekly.

Buyers are not waiting around for this data to catch up. Google and NRG’s B2B buyer journey research found that about 75% of B2B buyers complete their purchase journey within 12 weeks, and 84% say AI tools are speeding that process up further. A dashboard that surfaces a signal a week late is reporting on a deal that already moved on without you.
Turning signals into next-best actions
A dashboard nobody acts on is a reporting exercise, not a sales tool. The value shows up when a signal triggers a specific action within hours, not when someone reviews it at the end of the month.
- Set trigger rules tied to stage: a late-stage ROI document viewed with no next step booked should alert the AE within a day, not surface in a weekly report.
- Treat a multi-stakeholder forward (a champion sharing a trailer with someone new) as a request to book a stakeholder meeting, not just a data point.
- Build role-based enablement packs so a seller can respond to a CFO engagement with pricing content and a CISO engagement with security content, automatically, without improvising.
- Automate mutual-action-plan updates when a milestone asset gets consumed, so the plan reflects reality instead of the last call.
- Run RevOps as a test function: measure time-to-next-step and win-rate lift for cohorts that received a given alert versus those that did not, then iterate.
Pro Tip: Control your trigger rules by stage and segment. An ROI document viewed twice means something different in week one than it does in week six, and treating every repeat view the same way produces alerts nobody trusts.
TrailerCast’s own buyer engagement alerts playbook walks through building these triggers without writing custom logic from scratch.
What this looks like inside TrailerCast
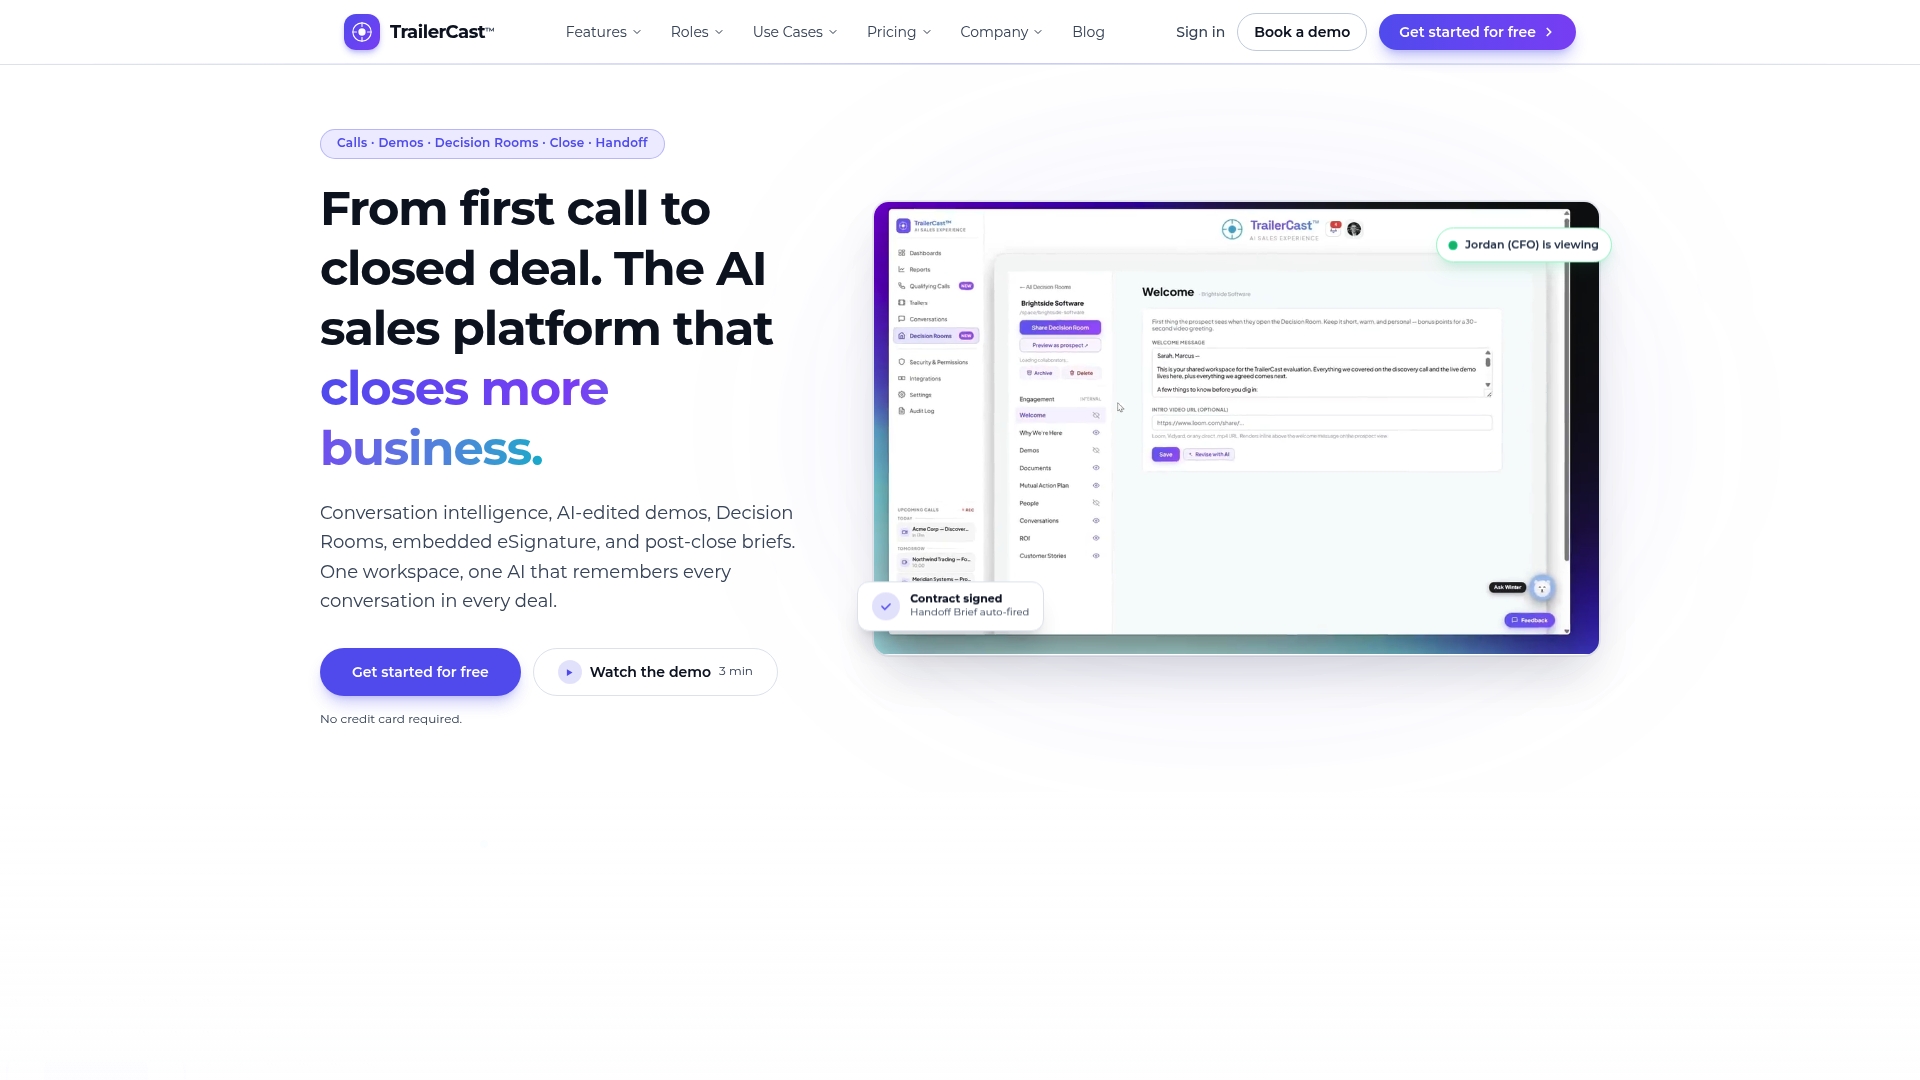
TrailerCast builds its Decision Rooms around this exact model instead of treating analytics as an add-on. Each room ties asset, deal, and outcome signals together in one view.
- A per-stakeholder engagement panel shows who opened what and when, mapped to the stage × persona × objective taxonomy.
- An attribution tree tracks who forwarded a trailer to whom, so a CFO’s first view shows up as a traceable event, not an anonymous click.
- The AI Sales Library auto-ranks which asset fits a given deal, so sellers are not guessing what to send next.
- A single AI brain follows the opportunity across calls, demos, and documents, so the Decision Room reflects the whole deal history instead of resetting with every new stakeholder.
For a closer look at the room itself, TrailerCast’s buyer portal and Decision Room page and feature overview walk through how each stage connects to the next.
What CROs should actually prioritize here

The teams that win more multi-stakeholder deals are not the ones with the most dashboards, they are the ones with the cleanest data feeding a fast feedback loop. Fix the tagging and the identity resolution before you fix the chart design.
Track shortlist placement, win-rate delta between alerted and non-alerted deals, and cycle-time reduction as your real ROI proxies. None of that works without sales, RevOps, enablement, and marketing agreeing on one taxonomy and one source of truth.
— Daniel
Where TrailerCast fits if you’re ready to act on this
If you have read this far, you already know the gap: the tagging, the dashboards, and the alert rules described above take real engineering time to stitch together across a call recorder, a video tool, a separate deal room, and a CRM. TrailerCast was built to skip that stitching entirely, with the engagement panel, attribution tree, and content ranking already wired into one Decision Room per deal.
It fits teams with multi-stakeholder buying committees, usually at small to medium-sized companies, where a sales or operations leader owns the stack and wants one workspace instead of five. For hands-on examples of how demo trailers and Decision Rooms work together, the demo trailer use case and full use-case library are worth a look, and for role-specific follow-up strategy, Deeplead’s work on hyper-personalized outreach pairs well with the alert playbook above.
TrailerCast runs on one plan with every feature included, starting at $59 per seat per month. You can start a free trial with no credit card at Trailercast.
Sources
- Buying Group Essentials | Forrester
- How do you analyze buyer engagement with sales content?
- Google B2B Buyer Journey (NRG/Google)
FAQ
What is the difference between asset-level and deal-level analytics?
Asset-level analytics measure how one piece of content performs, like completion rate or repeat views. Deal-level analytics measure how many stakeholders engaged, how recently, and whether they forwarded content to others, which shows whether the whole buying group is moving together.
How many people are typically involved in a B2B buying group?
Forrester found that the average number of participants in a B2B buying group is typically in the low teens, which is why tracking a single champion’s engagement misses most of the signal. Deal room analytics exist specifically to surface that wider group’s activity.
How fast do B2B buyers move through the purchase journey now?
Research from Google and NRG found that a substantial majority of B2B buyers complete their journey within approximately three months, with a large proportion saying AI tools speed the process further. That pace is why alerts need to fire within hours of a signal, not at the next weekly review.
Does TrailerCast replace a separate deal room tool?
TrailerCast includes Decision Rooms as one stage of its platform, alongside conversation intelligence, AI-edited demo trailers, eSignature, and post-close handoff, all in one plan with every feature. It is built for teams that want this reporting without maintaining a separate point solution for each stage.
What is the biggest mistake teams make when building deal room dashboards?
The most common mistake is ranking content by raw view count instead of controlling for deal stage, which makes late-stage assets look more effective simply because they appear in more advanced deals. Pedowitz Group recommends stage-controlled cohort comparisons instead.