4 Sales Pipeline Metrics for Reliable Revenue Forecasts

The metrics that predict revenue come down to four numbers: pipeline coverage ratio, win rate, sales velocity, and sales cycle length. Track those together and you can answer the three questions every forecast depends on: do we have enough pipeline, is it moving fast enough, and can we trust what’s in it. Everything else in your CRM is supporting detail.
TL;DR:
- A pipeline coverage ratio should be based on your team’s win rate and typically ranges from 2x for higher win rates to 5x for lower ones to avoid forecast gaps.
- Sales velocity, calculated by dividing the dollar-per-day throughput by sales cycle length, is the most actionable metric to predict deal timing and forecast accuracy.
- Improving pipeline hygiene metrics like stage accuracy, close-date reliability, and lead qualification directly enhances the quality of your forecast, especially when combined with activity and response time data.
- Using cohort-based probability models for larger teams yields more accurate forecasts than static stage percentages, provided you have at least a year of consistent data.
- Market shifts, such as economic downturns or seasonal patterns, require ongoing recalibration of coverage multiples and win-rate assumptions, rather than relying on static benchmarks.
Table of Contents
- Quick Actions for Your Next Pipeline Review
- What Are Sales Pipeline Metrics, Exactly?
- Why These Metrics Matter for Forecasting
- The Core Pipeline Metrics Every Forecast Needs
- Building Dashboards and Setting Review Cadence
- Turning Metrics Into a Reliable Forecast
- Where Better Deal Data Comes From
- How Lead Response Time Shapes Your Pipeline Numbers
- Quota Attainment and What It Tells You About Pipeline Health
- Pipeline Quality: Lead Source and Qualification Scoring
- How Calls, Emails, and Demos Move Deals Forward
- Common Mistakes When Reading Pipeline Metrics
- How Market Conditions Change Your Baseline Numbers
- A 30/60/90 Checklist for RevOps Leaders
- Where TrailerCast Fits Into Your Pipeline Metrics
- Sources
Quick Actions for Your Next Pipeline Review
Before you dig into definitions and formulas, run these checks in your next pipeline review meeting. They take fifteen minutes and usually surface the problem before you finish the agenda.
- Compare your coverage ratio to 1 ÷ your team’s win rate. If a 25% win rate calls for 4x coverage and you’re sitting at 2.8x, you have a gap, not a forecast.
- If sales velocity has dropped noticeably compared to your trailing average, stop and run a deal-advancement review before the next forecast call.
- If weighted pipeline is dramatically lower than simple pipeline, too much of your book sits in early stages. Quarantine those deals and put qualification ahead of quantity.
Pro Tip: Screenshot your coverage ratio and velocity number every Friday. Six weeks of screenshots tells you more about trendlines than any single dashboard snapshot ever will.
What Are Sales Pipeline Metrics, Exactly?
A metric is a measurement. A KPI is a metric with a target attached and a defined response when you miss it. “Win rate is 22%” is a metric. “Win rate must stay above 25%, or we pause outbound spend and audit qualification” is a KPI. Most sales teams track plenty of metrics and almost no KPIs, which is why pipeline reviews turn into status updates instead of decisions.
You’ll also hear “simple pipeline value” and “weighted pipeline value” used loosely. Simple pipeline just adds up every open deal’s dollar amount. Weighted pipeline multiplies each deal by its stage probability, so a $50,000 deal at 20% probability contributes $10,000 to the weighted total. Neither number means anything if your team defines stages inconsistently or lets close dates drift. Clean data is the price of admission for every metric that follows.
Why These Metrics Matter for Forecasting
Every pipeline metric exists to answer one of three questions: Do we have enough? Is it moving? Is it real?
Coverage ratio answers “enough.” Stage-to-stage conversion and velocity answer “moving.” Deal age and hygiene metrics answer “real.” A team that only watches coverage without checking velocity can look funded on paper while every deal quietly stalls in the same stage for two quarters. Predictive pipeline reporting works better than vanity metrics precisely because it forces you to look at movement, not just volume.
The coverage math itself is simple, and most teams get it wrong. The correct coverage multiple is the inverse of your win rate, not a flat “3x pipeline” rule borrowed from a conference talk. A 50% win rate needs roughly 2x coverage. A 20% win rate needs 5x. Apply one number across a whole book of business with mixed segments, and you’ll misjudge exactly the deals that matter most.
The Core Pipeline Metrics Every Forecast Needs
These are the foundational metrics worth building into every dashboard and every pipeline review agenda. Copy the formulas directly.
Sales teams that calibrate coverage targets by win rate instead of using a flat multiple catch funding gaps roughly one full quarter earlier, because they’re comparing apples to apples across segments instead of averaging away the warning signs.
- Pipeline coverage ratio. Formula: total (or qualified) pipeline value ÷ revenue target. Benchmark: a multiple calibrated to your actual win rate using the inverse rule above rather than copying an industry average. A team with a 33% win rate needs coverage close to three times their target; a team converting at 15% needs significantly more coverage.
- Win rate. Formula: closed-won deals ÷ total closed deals (won plus lost), measured at both the cohort level and the individual stage level. Median B2B win rates vary widely by segment, so a single blended number may not give an accurate picture. Segment by deal size or motion (SMB, mid-market, enterprise) before you trust the figure.
- Sales velocity. Formula: (number of open opportunities × average deal size × win rate) ÷ average sales cycle length in days. This produces a dollar-per-day throughput figure that tells you not just whether you’ll hit the number, but roughly when. It’s the single most useful combined metric for timing a forecast, because it compresses four variables into one that moves when any of them move.
- Average deal size. Track on a rolling 90-day window, not lifetime average. Shrinking deal size quietly increases the coverage you need and the headcount required to hit the same revenue target, even when win rate stays flat.
- Sales cycle length and time in stage. Median cycle length matters less than the distribution around it. A deal sitting in “proposal” three times longer than your segment norm isn’t slow, it’s stuck, and those are different problems requiring different responses.
- Stage-to-stage conversion rates. Calculate each stage’s conversion separately (discovery to demo, demo to proposal, proposal to close) instead of one blended number. This is how you find the specific stage bleeding deals rather than guessing.
- Pipeline creation rate. New qualified opportunities added per week or month. This is your leading indicator: a coverage problem three months from now is visible in a creation-rate slump today.
- Deal age and stale pipeline. Define stale explicitly, for example no stage change and no logged activity in 30 days, then re-qualify or remove those deals from committed forecast math. Deals that run past 1.5 times your average sales cycle rarely close and routinely inflate coverage numbers that then mislead the whole forecast.
- Weighted pipeline and probability-adjusted forecasting. Weighted pipeline beats simple pipeline for prediction because it bakes in stage conversion likelihood. For teams with enough closed-deal history, a cohort-based model, tracking how a specific month’s opportunities actually converted, often outperforms a generic stage-probability table.
- Pipeline hygiene metrics. Close-date accuracy, stage accuracy, duplicate deal counts, and ownerless deals. None of these are glamorous, and all of them determine whether the nine metrics above mean anything at all.
Building Dashboards and Setting Review Cadence
Match what you measure to how often you measure it, or you’ll drown reps in dashboards they check once and ignore. The right cadence generally splits three ways.
- Daily: New opportunities created, activity counts, and pipeline creation rate. Use these for rep-level triage, not strategic decisions.
- Weekly: Coverage ratio, deal-aging distribution, and stage conversion rates. Run a hygiene sweep and coach on any deal that’s stalled longer than your defined threshold.
- Monthly or quarterly: Sales velocity, win-rate trends, and average deal-size shifts. This is when you recalibrate coverage targets and revisit hiring plans, not weekly.
For visualizations, a funnel distribution chart catches stage bottlenecks at a glance, a velocity sparkline shows trend direction faster than a single number ever could, and an age histogram exposes which deals are quietly aging out. Side-by-side weighted versus simple coverage is worth a permanent spot on any executive view; a partner dashboard resource is a useful reference if you’re designing that layout from scratch.
Pro Tip: Put the weighted-versus-simple coverage comparison at the top of your weekly deck, not the bottom. It’s the fastest way to catch a rep who’s stuffing the pipeline with unqualified deals to hit an activity number.
Turning Metrics Into a Reliable Forecast
A forecast only needs four real inputs: weighted pipeline by stage, historical stage-to-stage conversion rates, average sales cycle length, and current velocity. Everything else is noise dressed up as precision.
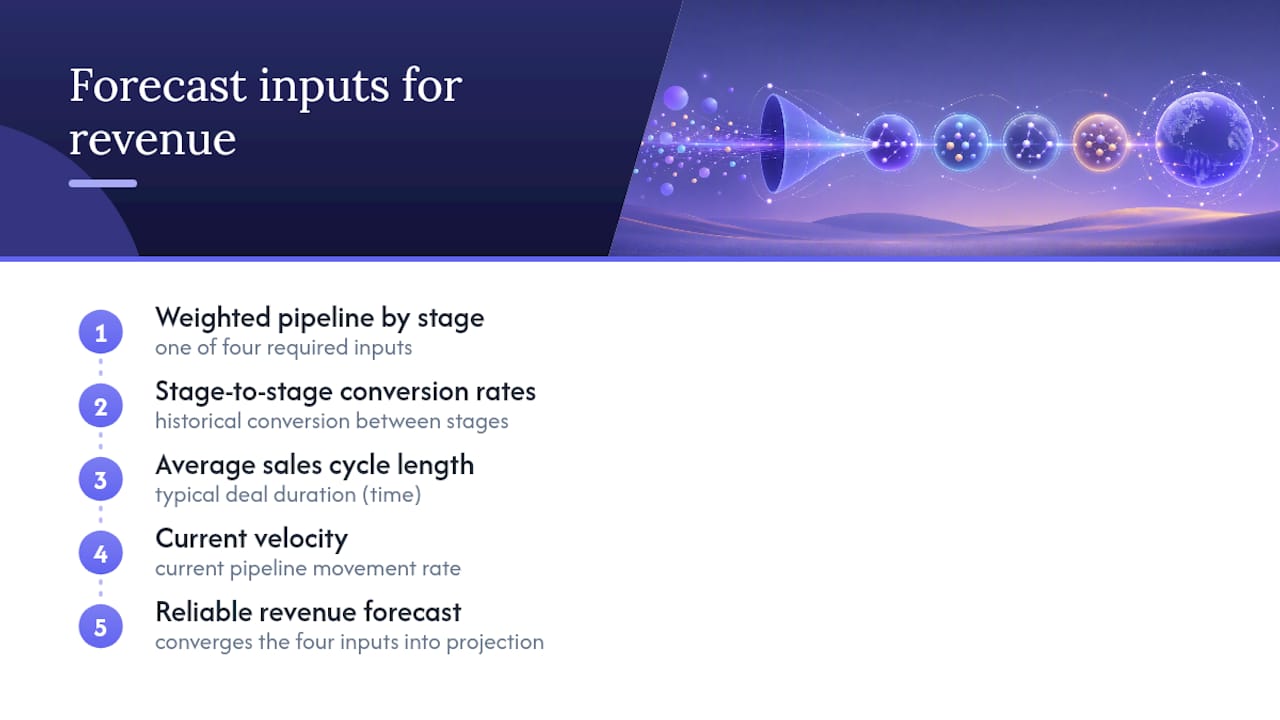
Choose your model based on data volume. A simple weighted-pipeline model works fine for smaller teams or newer segments without much closed-deal history. Once you have a year or more of consistent stage data, a cohort-probability model, tracking how deals created in a given month actually converted, tends to outperform static stage percentages.
Where Better Deal Data Comes From
Most pipeline hygiene problems trace back to bad inputs, not bad math. Stage accuracy improves when notes come from an actual transcript instead of a rep’s memory a week later. Close-date accuracy improves when the deal record reflects what a buying committee actually said on a call, not what a rep hoped they’d say.
Consolidated conversation intelligence and engagement analytics tighten stage accuracy by tying every stage change to a real, timestamped event. AI-generated deal briefs and handoff summaries cut down on stale, ownerless pipeline because context doesn’t disappear when a rep changes territory. [Author credentials and customer case study placeholder.]
How Lead Response Time Shapes Your Pipeline Numbers
The speed of your first response to a new lead shows up in nearly every downstream metric you track. Respond within minutes and you tend to see higher qualification rates flowing into stage one, which improves your stage-to-stage conversion numbers before a rep even opens their mouth. Respond hours or days later and that same lead either goes cold or gets contacted by a competitor first, quietly depressing your win rate without ever showing up as a distinct line item.
This is why response time deserves its own tracked metric, separate from activity counts. A team can hit its daily call quota and still leak revenue if those calls happen twelve hours after the lead came in instead of twelve minutes. Fast response also compresses your sales cycle length, because early rapport and early qualification remove friction later in the deal.
If your pipeline creation rate looks healthy but your stage-one-to-stage-two conversion is weak, check response time before you blame lead quality. It’s a cheaper fix than replacing your lead source, and it’s usually the actual problem. Set a response-time target as a real KPI, not just a metric you glance at, with a defined action when reps miss it, and route new leads by workload so no one becomes the bottleneck simply because they’re mid-demo when a new lead lands.
Quota Attainment and What It Tells You About Pipeline Health
Quota attainment measures outcomes, but the pipeline metrics behind it tell you why attainment is trending the way it is, weeks before the number itself moves.
The relationship runs in both directions. Attainment trends validate whether your coverage math is actually calibrated correctly, or whether it just looks right on a spreadsheet. If a rep consistently carries strong coverage but weak attainment, the problem usually isn’t pipeline volume, it’s stage quality, deal age, or an inflated commit built on deals that were never going to close on schedule.
Segment attainment analysis by rep tenure and deal-size band before drawing conclusions. Treating those two situations the same wastes coaching time and misreads what’s actually broken. Track attainment alongside coverage ratio and deal age on the same view, not as a separate report reps see once a quarter, so gaps surface while there’s still time to close them.
Pipeline Quality: Lead Source and Qualification Scoring
Not every dollar of pipeline is worth the same. Two deals with identical size and stage can have wildly different odds of closing depending on where the lead came from and how well it was qualified going in.
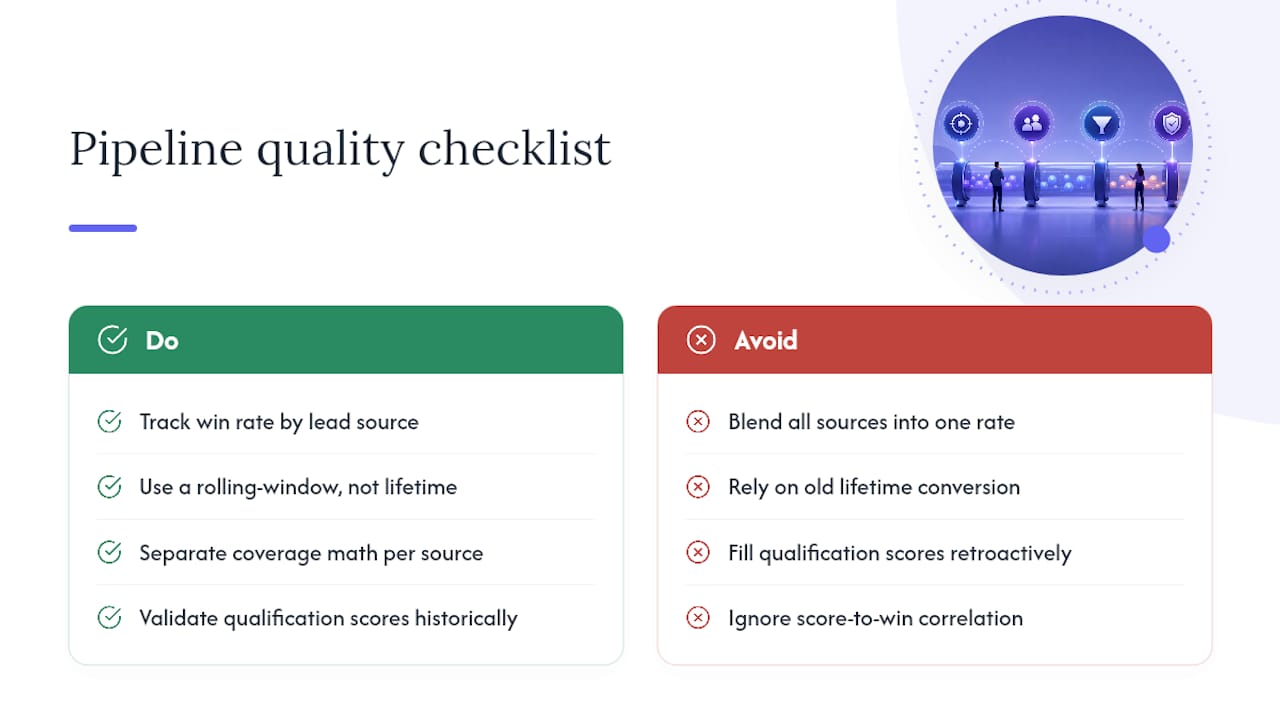
Track win rate by lead source over a rolling window, not lifetime, since source quality shifts as marketing programs and market conditions change. A source that converted well two years ago can quietly become your worst producer without anyone noticing until someone actually pulls the segmented data. Outbound-sourced deals, inbound demo requests, and partner referrals routinely convert at different rates and deserve separate coverage math, not one blended assumption.
Qualification scores, whether built on a formal framework like MEDDIC or BANT or a simpler internal checklist, matter less for the scoring itself than for whether reps apply it consistently before a deal enters the pipeline. A qualification score that gets filled in retroactively to justify a deal already in motion isn’t a quality signal, it’s a paperwork exercise. The real test: does a low qualification score actually predict a lower win rate in your own closed-deal history? If it doesn’t correlate, the framework needs revisiting, not the reps using it.
Pair lead-source win rate with qualification score distribution and you get an early warning system for pipeline quality that shows up well before deals start dying in later stages.
How Calls, Emails, and Demos Move Deals Forward
Activity volume and pipeline progression are related, but not in the straight line most dashboards assume. What actually moves a deal is the quality and timing of an activity relative to where the buyer is in their own decision process, not the raw count of touches logged that week.
A well-run discovery call that surfaces a real budget and timeline advances a deal further than five generic check-in emails combined. Demos carry outsized weight here, because a demo that lands with the full buying committee, not just the champion, tends to produce faster stage-to-stage conversion than one where the champion has to relay everything secondhand. That secondhand relay is where deals quietly die, in a meeting the seller never attends.
This is exactly the gap that turns a good demo call into a stalled deal three weeks later. When a champion walks a CFO through a recording nobody will fully rewatch, or tries to answer security questions from memory, momentum dies in a room the seller wasn’t in. Structured call and demo analysis consistently shows that deals stall less when the follow-up artifact does the selling instead of the seller’s memory.
Measure activity by conversion impact, not raw count: which specific activities preceded a stage change in your historical data, and which just filled a rep’s calendar without moving anything.
Common Mistakes When Reading Pipeline Metrics
The most common error is treating a single metric as the whole story. Strong coverage with weak velocity looks fine on a summary slide and falls apart the moment you check whether those deals are actually moving. Always read coverage, win rate, and velocity together, never one in isolation.
A second mistake: comparing this quarter’s numbers to a blended annual average instead of a like-for-like segment. Enterprise deal cycles run longer than SMB by design, and averaging them together produces a benchmark that’s wrong for both groups.
A third: confusing correlation with causation when a metric moves. Win rate dipping the same month a competitor launched a new feature doesn’t mean your qualification process broke, though it might. Check stage conversion by rep and by source before assuming the whole team suddenly got worse at selling.
And the quiet one: letting weighted pipeline sit stale because nobody updates stage probabilities after the initial model gets built. A model that was accurate two years ago drifts as your sales motion changes, and nobody notices until the forecast misses by a wide margin twice in a row.
How Market Conditions Change Your Baseline Numbers
Pipeline metrics don’t exist in a vacuum, and treating a benchmark as permanent is a fast way to misread a good quarter as bad or vice versa. Buyer budget cycles, economic tightening, and category-specific spending shifts all move win rate and cycle length independently of anything your team is doing right or wrong.
When budgets tighten across a market, deals that would have closed in 45 days start taking 70, not because your reps got worse, but because more stakeholders now need to sign off before spend clears. That shift shows up first in sales cycle length, then in win rate, and only later in revenue, which is exactly why velocity as a leading indicator matters more during uncertain periods than during stable ones.
Seasonal patterns matter too. A B2B software team selling primarily to finance buyers will see very different pipeline creation patterns around fiscal year end than a team selling to marketing departments on a calendar-year budget. Benchmark your own historical seasonality before assuming a slow month reflects a broken process.
The practical response isn’t panic, it’s recalibration. Revisit your coverage multiple and win-rate assumptions every quarter, not annually, so a market shift shows up as a deliberate adjustment to your model instead of a surprise miss on the forecast call.
A 30/60/90 Checklist for RevOps Leaders
If you’re taking over a pipeline that nobody’s cleaned in a while, the sequence matters more than the tools. In the first 30 days, fix the data: enforce stage definitions and set an honest coverage baseline. In the next 30, chase velocity bottlenecks and coach demo-to-proposal conversion. By day 90, judge forecast accuracy against actuals and adjust your coverage multiple accordingly.
— Daniel
Where TrailerCast Fits Into Your Pipeline Metrics
Better metrics start with better inputs, and most pipeline hygiene problems trace straight back to what happens between calls, not during them. Trailercast runs the entire deal lifecycle in one workspace: conversation intelligence that logs every call automatically, AI-edited demo trailers your champion can actually forward to the CFO who wasn’t there, decision rooms that track who’s engaging and who’s gone quiet, embedded eSignature, and a handoff brief that fires the moment a deal closes.
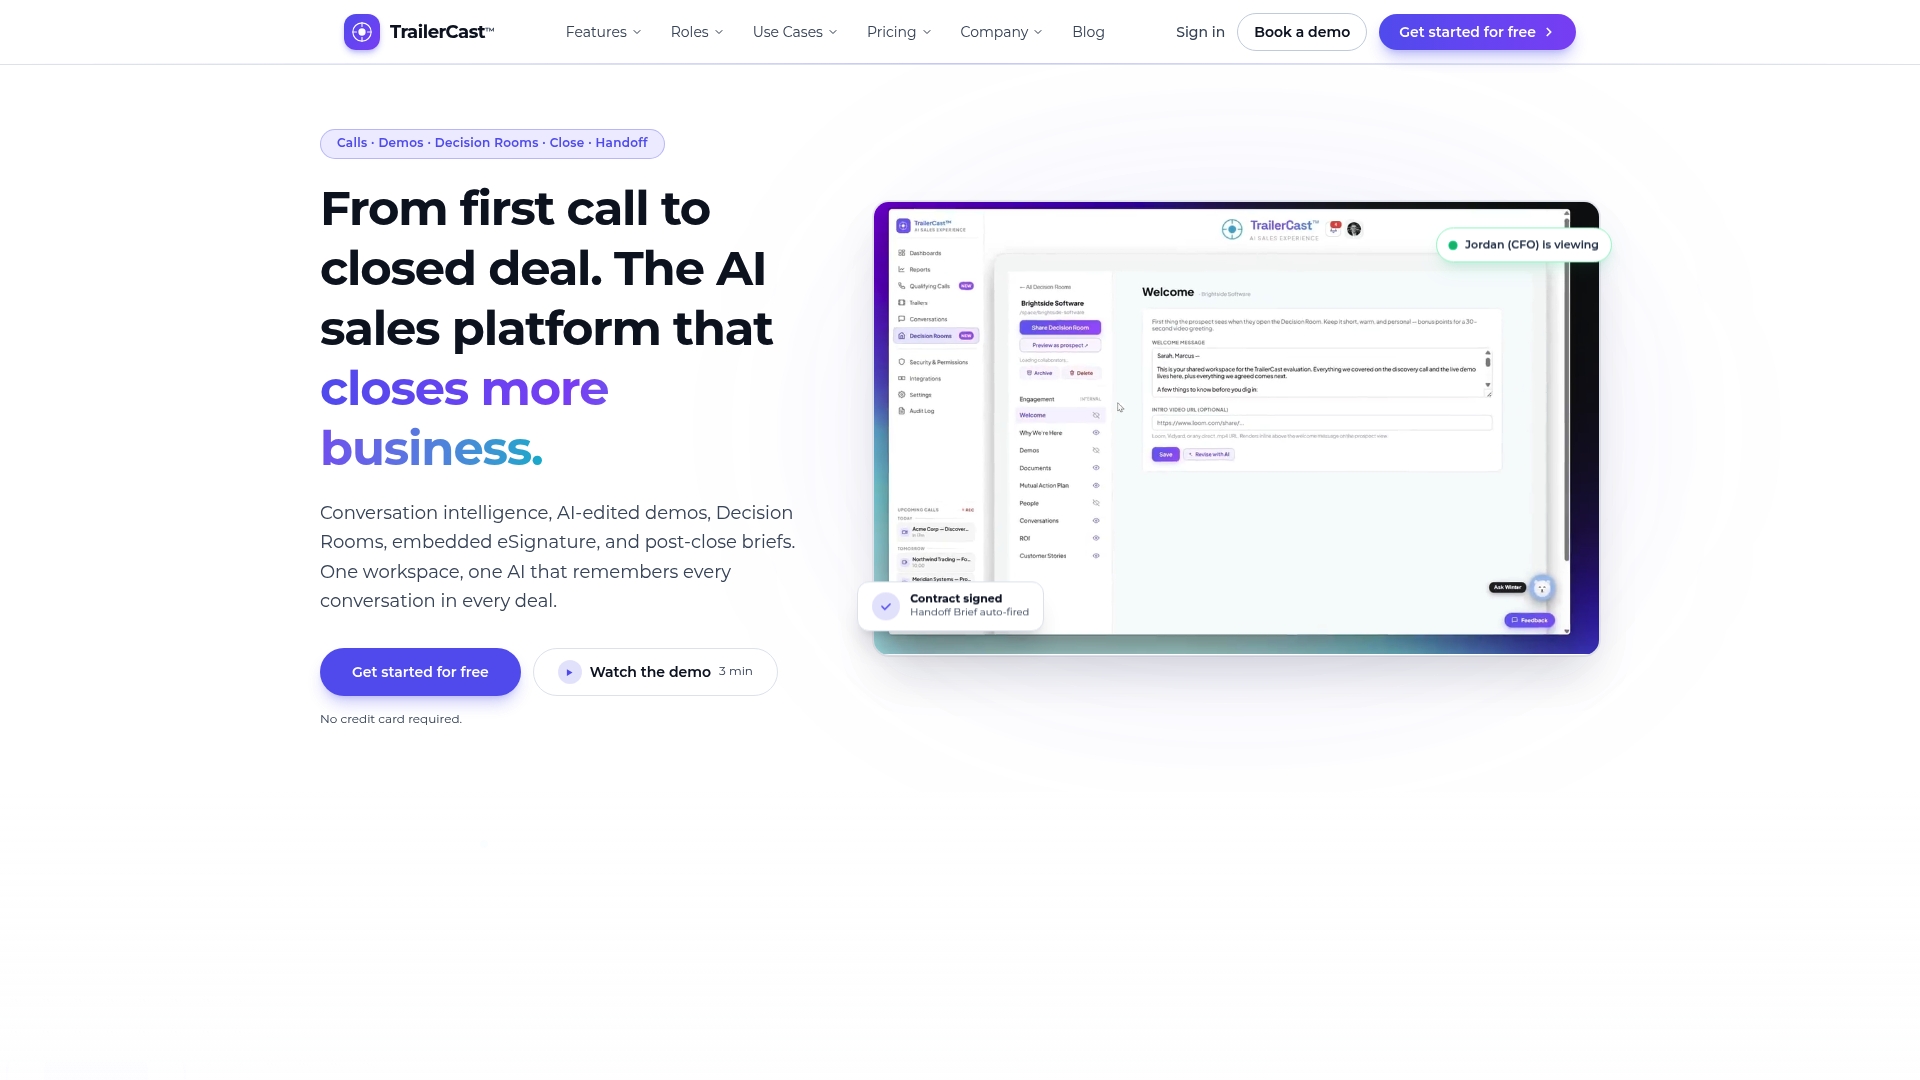
That consolidation is what feeds cleaner numbers. Stage changes tie to real, timestamped events instead of a rep’s memory. Close dates stop drifting because the platform tracks buyer engagement directly. Stale deals surface faster because you can see, per stakeholder, exactly who stopped opening the decision room and when. If your forecast has been missing because the underlying pipeline data was never trustworthy in the first place, that’s the layer worth fixing. Start a free trial and see what your own pipeline looks like with cleaner inputs behind it.
Sources
- Predicting revenue: 10 essential sales pipeline metrics - Mural
- Sales pipeline metrics that predict revenue - LeadIQ