Sales Engagement Analytics: What to Track and Why

Sales engagement analytics is the practice of measuring and interpreting every buyer interaction — emails, calls, meetings, and content views — to spot which behaviors move deals forward and which ones stall them. For a sales manager, the payoff is simple: it turns raw activity into early-warning signals and coaching material you can act on this week, not next quarter.
The fastest path to value isn’t a new dashboard. It’s picking one KPI that matters to your pipeline right now and connecting it to a single reliable data source.
- Reply rate or call connect rate are good starting KPIs for most SDR teams.
- Meeting-to-opportunity conversion works better if your team is further along the funnel.
- Connect that KPI to a system you already trust — your CRM’s activity feed, your dialer’s call logs, or your meeting platform’s transcript data — before you touch a second one.
Everything past that first step is refinement.
Key Takeaways
Sales engagement analytics works because it converts scattered interaction data into specific, timely actions a manager can take before a deal is lost.
| Point | Details |
|---|---|
| Start with one KPI | Pick reply rate or call connect rate and connect it to one reliable data source before adding more. |
| Match metrics to role | Weight activity metrics for SDRs and engagement breadth or demo engagement for AEs. |
| Use benchmarks by channel | Compare reply rates to reply rates and content engagement to content engagement, never across formulas. |
| Turn signals into scripts | Convert a rep-level divergence into a specific coaching script, not a generic feedback note. |
| Trailercast consolidates the data | Its call notetaker, demo trailers, and decision rooms feed engagement metrics into one workspace instead of five disconnected tools. |
Table of Contents
- What Sales Engagement Analytics Is and How It Works
- Core Engagement Metrics and How to Calculate Them
- How Managers Use Engagement Data Day to Day
- Six Steps to Get Usable Sales Engagement Analytics Running
- Turning Signals Into Coaching and Experiments
- How a Single Workspace Cuts Through Fragmented Data
- Why Most Teams Overinvest in Dashboards and Underinvest in Follow-Through
- See How Trailercast Puts Engagement Data in One Place
- Frequently Asked Questions
- Sources
What Sales Engagement Analytics Is and How It Works
Sales engagement analytics pulls data from wherever prospect interactions happen. That typically means five sources: email platforms (opens, clicks, replies), phone system metadata (call duration, connect outcomes), meeting platforms (attendance, talk ratios, transcripts), content hosting (who viewed a deck or demo and for how long), and CRM activity logs that stitch it all to a specific opportunity. The analytics layer aggregates these multi-channel interactions into KPIs like open rates, reply rates, and meeting-booking rates, according to Saber’s overview of sales engagement analytics.
Getting from raw event to usable metric takes three steps:
- Capture — every touchpoint gets logged with a timestamp, participant list, and channel.
- Normalize — events get mapped to a specific contact, deal stage, and outcome so a call on Tuesday and a follow-up email on Thursday are recognized as part of the same sequence.
- Attribute — the system links engagement patterns to what happened next: did the deal advance, stall, or die.
This is where engagement analytics separates from plain CRM reporting. A CRM tells you a call happened. Salesforce’s CRM Analytics documentation shows how dashboards built on this layer let managers view engagement by rep, sequence, and channel, rather than just counting logged activities.
Pro Tip: Before you connect a new tool, audit whether your CRM’s existing activity fields are even being filled in consistently. Half of “bad analytics” is actually bad data entry upstream.
One quick note on consent: any tool recording calls or tracking content opens should have a clear internal policy for participant notification and data retention, especially across regions with different disclosure requirements.
Core Engagement Metrics and How to Calculate Them
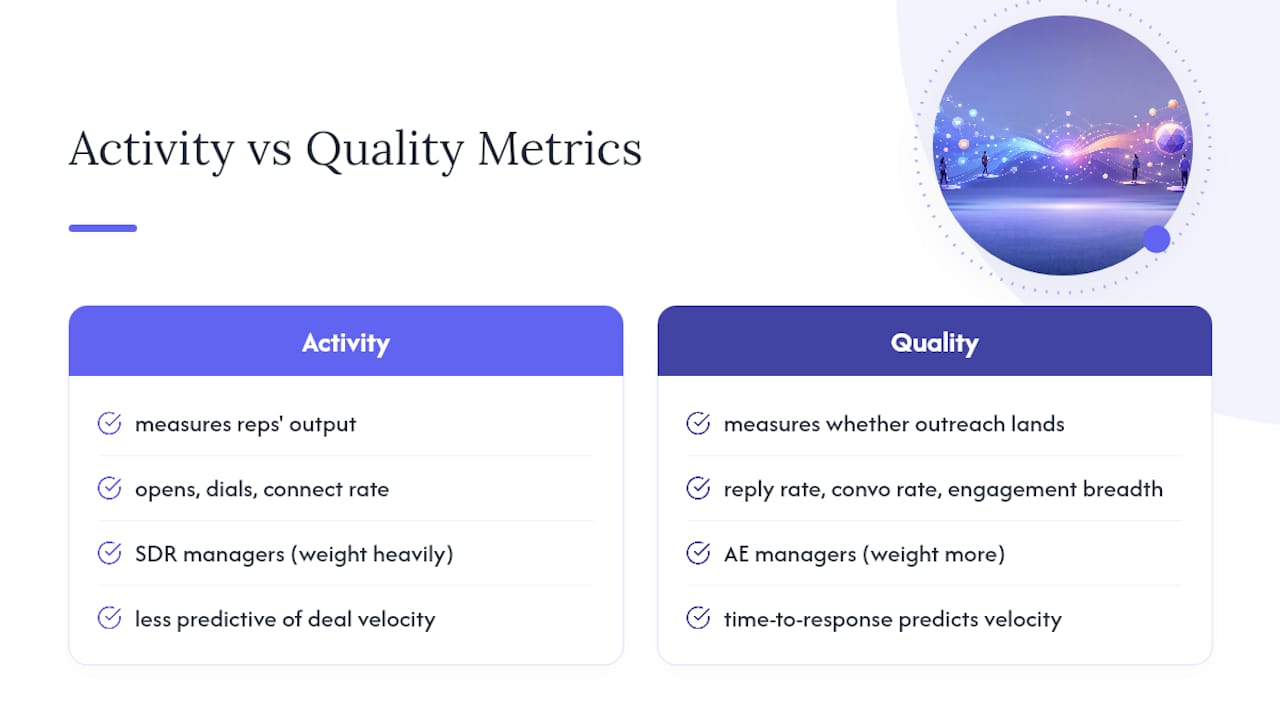
Standardizing your KPI definitions before you build a dashboard saves you from the argument every RevOps team eventually has: “wait, whose reply rate is this?” Here’s a working reference.
Activity metrics (opens, dials, connect rate) tell you whether reps are doing the work. Quality metrics (reply rate, conversation rate, engagement breadth) tell you whether the work is landing. SDR managers should weight activity and connect metrics heavily since outbound volume still drives pipeline creation. AE managers get more value from engagement breadth and demo engagement, since those signal whether a deal is being sold to one champion or an actual buying committee.
Benchmark check: Engagement rate benchmarks vary meaningfully by channel and industry, with useful reference ranges running roughly 1% to 5% depending on the platform. Don’t import a social-media benchmark and apply it to cold email reply rates. Match the formula and comparison set to the channel you’re actually measuring.
Time to response deserves special attention. It’s one of the few metrics that predicts deal velocity almost as reliably as it predicts rep discipline. A rep who replies within an hour to an inbound question is running a different sales motion than one who replies the next day, even if their other numbers look identical.
How Managers Use Engagement Data Day to Day
Numbers on a dashboard don’t close deals. What they do is point you toward four specific manager actions.
Coaching on rep-level divergence. When one rep’s reply rate is double the team average, the fix isn’t a generic “improve your outreach” note. Pull their top three sequences, compare subject lines and opening lines against the team’s median performers, and turn the difference into a script the rest of the team can copy. Salesforce’s own guidance on sales analysis makes the same point: analysis doesn’t replace leadership, it reveals the specific behavior worth replicating.
Cadence experiments. Run controlled tests on timing, channel mix, and sequence length rather than guessing.
- Test send time (morning vs. afternoon) across a fixed sample size for two weeks.
- Test channel order (call first vs. email first) and measure reply rate, not just activity volume.
- Test sequence length (5-touch vs. 9-touch) and track where response rate actually drops off.
Pipeline risk detection. A deal with no engagement in 10 to 14 days is a flashing warning sign, not a scheduling coincidence. The prescribed intervention depends on the cause: if only one stakeholder has engaged, the fix is multi-threading with content tailored to the missing roles. Real-world patterns bear this out. Saber’s analysis of engagement data describes cases where a structured 7-touch cadence over 14 days produced measurably higher response than scattershot outreach, and where early-warning alerts on stalled deals let managers recover a meaningful share of at-risk opportunities before they went cold.
- Flag deals with zero engagement in 10+ days.
- Check engagement breadth: is only one person on the buying committee involved?
- Assign a specific re-engagement action (a tailored follow-up, a new stakeholder-specific asset) rather than a generic check-in email.
Revenue attribution. Tie engagement patterns to deal velocity and win rate over time. If deals with three or more engaged stakeholders close 20% faster than single-threaded deals, that’s a resourcing argument, not just a nice chart.
Six Steps to Get Usable Sales Engagement Analytics Running
Implementation fails most often because teams try to track everything at once. Here’s a sequence that avoids that trap.
- Audit your data sources. List every system that touches a prospect interaction: CRM, calendar, phone system, email platform, content hosting. Identify the gaps, usually between call activity and content engagement, since those two rarely live in the same tool.
- Define four to six KPIs. Pick metrics from the table above, write down the exact formula, and assign an owner for each one. More than six KPIs at launch means nobody actually reviews any of them.
- Normalize and enrich the data. Standardize how contacts and companies are named across systems, and map every event to a specific deal stage so engagement history doesn’t fragment across tools.
- Build dashboards and alerts. You need two views: a weekly review dashboard for trend analysis, and real-time alerts for time-sensitive risks like a stalled deal or a missed follow-up.
- Set a review cadence with clear ownership. Practitioner frameworks recommend a repeatable loop: gather data, define KPIs, find patterns, act, and monitor. Decide upfront who reviews the weekly dashboard and who owns each alert type.
- Run experiments and update your benchmarks. Your first-quarter numbers are a baseline, not a target. Revisit them every quarter as your team, market, and product evolve.
Pro Tip: Assign a single owner for data hygiene, usually someone in RevOps or sales ops. Without one person accountable for consistent tagging and enrichment, even a well-designed dashboard degrades within a few months.
Turning Signals Into Coaching and Experiments
The gap between having data and using it well comes down to a translation problem: turning a number into an action.
- Low reply rate → review subject lines and opening lines against your team’s top performers, not against generic templates.
- Narrow engagement breadth → introduce multi-threading, with content built for each stakeholder role rather than one generic deck sent to everyone.
- High call connect rate but low conversation rate → the issue isn’t dial volume, it’s call quality or targeting.
- Slow time-to-response → check whether the bottleneck is workload, tooling friction, or unclear ownership of inbound leads.
When you test a fix, run it as an actual experiment. Split your team or your account list, apply the change to one group, hold the other steady, and compare results over a fixed window, at least two to four weeks for most B2B cycles, long enough to smooth out normal week-to-week noise. Report the result upward with the baseline number attached, not just the improved one; a 15% lift means nothing without the starting point.
One caution: benchmarks vary by channel and role, so comparisons should match the formula to the context you’re measuring, organic content engagement and cold outreach reply rates are not interchangeable numbers. Resist the urge to overreact to a single bad week. One dip in reply rate is noise; a three-week downward trend is a signal worth investigating. Gartner frames sales engagement as a discipline that pays off specifically when paired with consistent analytics and automation, not sporadic dashboard checks after a rough month.
How a Single Workspace Cuts Through Fragmented Data
The steps above assume your data lives in one place. In practice, most sales teams are stitching together a call recorder, a video tool, a deal room, an eSignature app, and a CRM, and losing signal in the gaps between them.
Trailercast was built around that specific problem. Its AI notetaker captures every call transcript and feeds structured summaries directly into the metrics layer, so conversation rate and talk-time data don’t require a separate integration. AI-edited demo trailers generate the content-engagement signal this article covers in the metrics table, showing exactly who watched what and for how long. Decision rooms track engagement breadth by recording which stakeholders actually opened shared material, and embedded eSignature closes the loop by tying that engagement history directly to close data and the handoff brief that follows.
- One AI layer follows the deal from first call to signed contract, so engagement history doesn’t fragment across five logins.
- Managers get engagement breadth and content-engagement metrics without stitching together separate video and deal-room tools.
Pro Tip: When evaluating any consolidated platform, ask specifically whether engagement data from a demo or shared asset flows back into the same record as your call transcripts. If it doesn’t, you’ve just rebuilt the fragmentation problem with fewer logins.
Why Most Teams Overinvest in Dashboards and Underinvest in Follow-Through
The biggest mistake I see in sales engagement analytics isn’t a bad metric choice. It’s treating the dashboard as the finish line. Teams spend weeks perfecting a KPI definition, then let the weekly review meeting devolve into a status readout instead of a decision-making session. The data was never the hard part. Acting on it consistently is.
Conventional advice tells managers to “track everything” and “let the data speak.” That’s backwards. The data only speaks if someone has already decided what a bad number means and what happens next. A sales enablement critique from Cognistry makes a related point about enablement content generally: information without a clear decision path in front of it just sits there.
If you take one thing from this article, prioritize the review-to-action loop over the metric catalog. Six well-owned KPIs with a documented response for each one beats twenty metrics nobody has time to interpret.
See How Trailercast Puts Engagement Data in One Place
Most of the friction in sales engagement analytics doesn’t come from picking the wrong metric. It comes from the data living in five different tools that don’t talk to each other. Trailercast was built to close that gap: one workspace where call transcripts, demo engagement, and decision-room activity all feed the same deal record, so a manager reviewing pipeline risk isn’t cross-referencing four logins to find out why a deal went quiet.
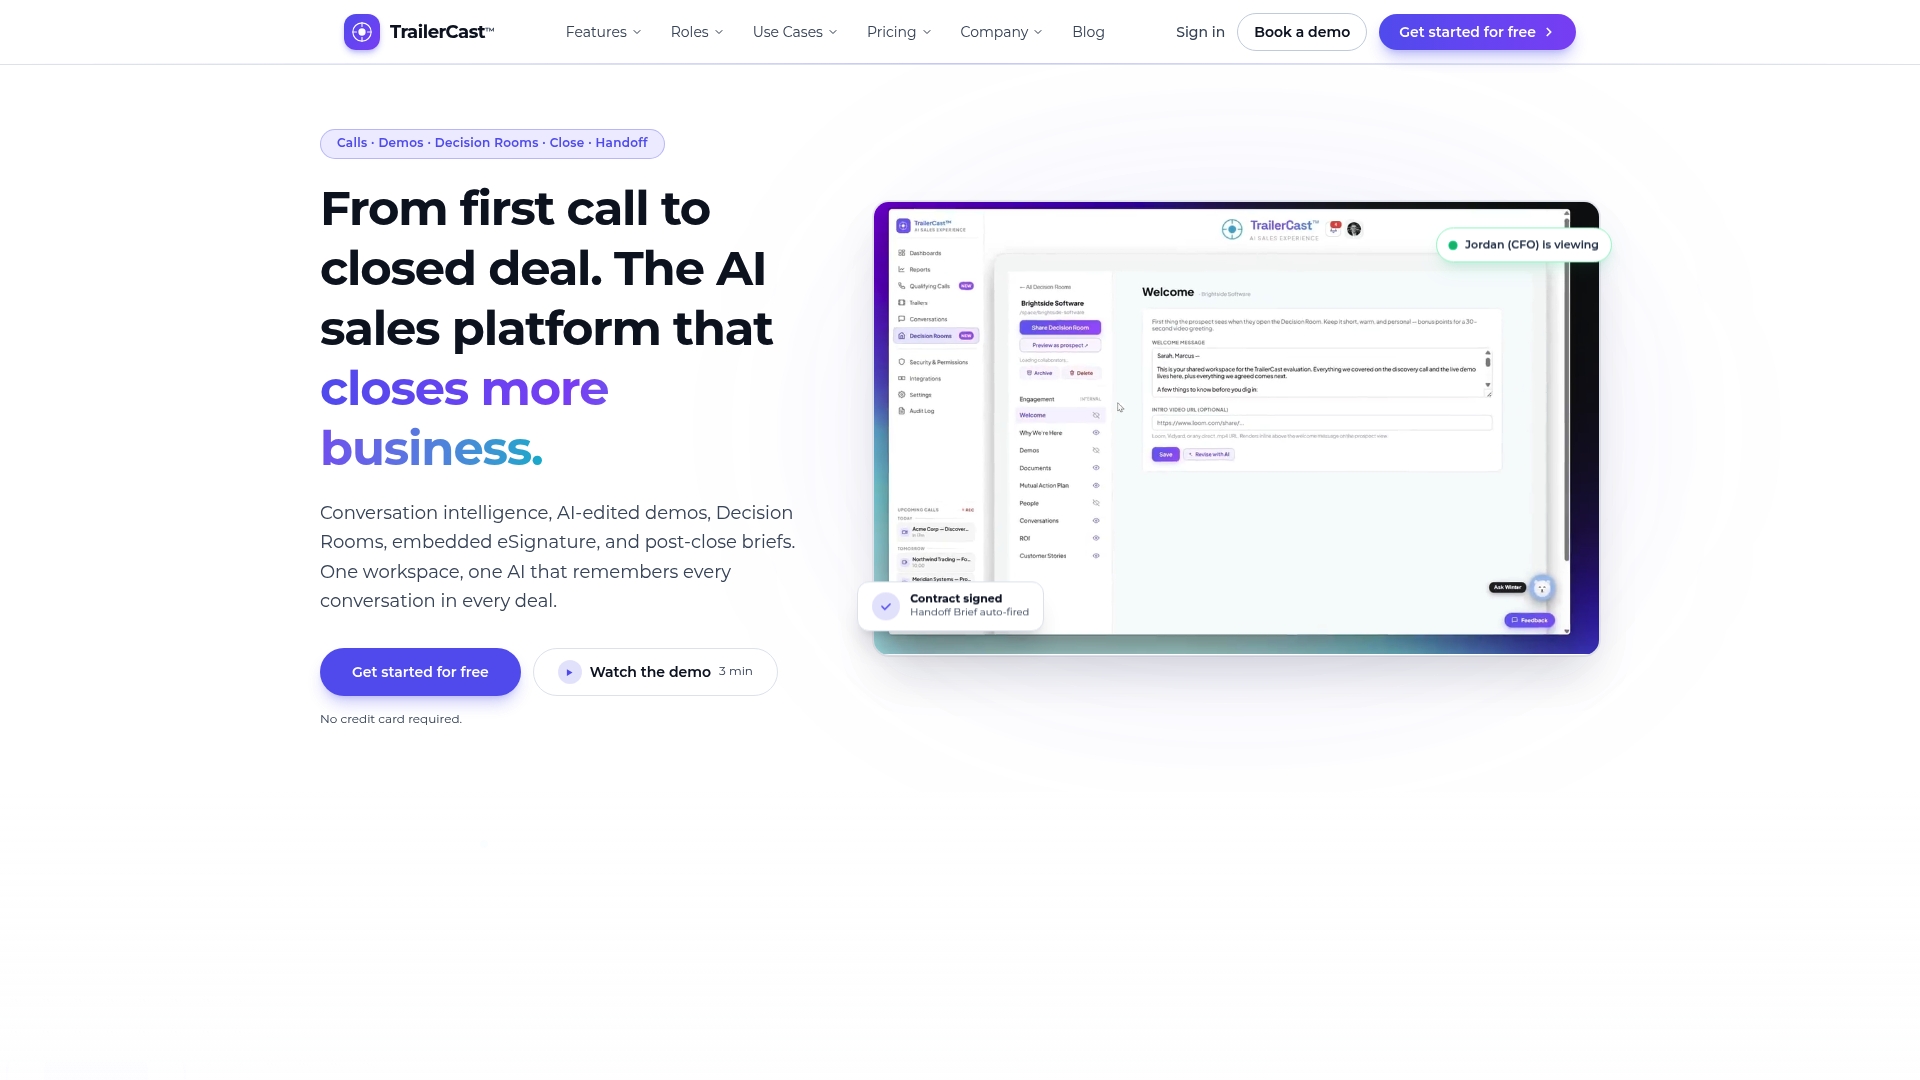
It fits teams with multi-stakeholder deal cycles, typically 11 to 200 employees, where a champion needs to sell internally to people who weren’t on your call. The platform runs pricing on a single tier with every feature included, at $79 per seat per month, or $59 billed annually, with a free trial and no credit card required. If engagement breadth and content tracking are the gaps you identified while reading this article, start a trial and connect your first deal to see the data land in one view instead of five.
Frequently Asked Questions
What is sales engagement analytics, in simple terms?
It’s the practice of measuring and analyzing every interaction between a sales rep and a prospect, emails, calls, meetings, and content views, to identify what’s working and where a deal is stalling, according to Saber’s glossary definition.
Do I need a separate tool if I already have a CRM?
Your CRM logs that an activity happened. Engagement analytics tools add the quality layer: talk ratios, reply sentiment, content watch time, and stakeholder-level engagement that a standard CRM field doesn’t capture. Many teams run both, with the analytics layer feeding structured data back into CRM records rather than replacing them.
How often should I review engagement metrics?
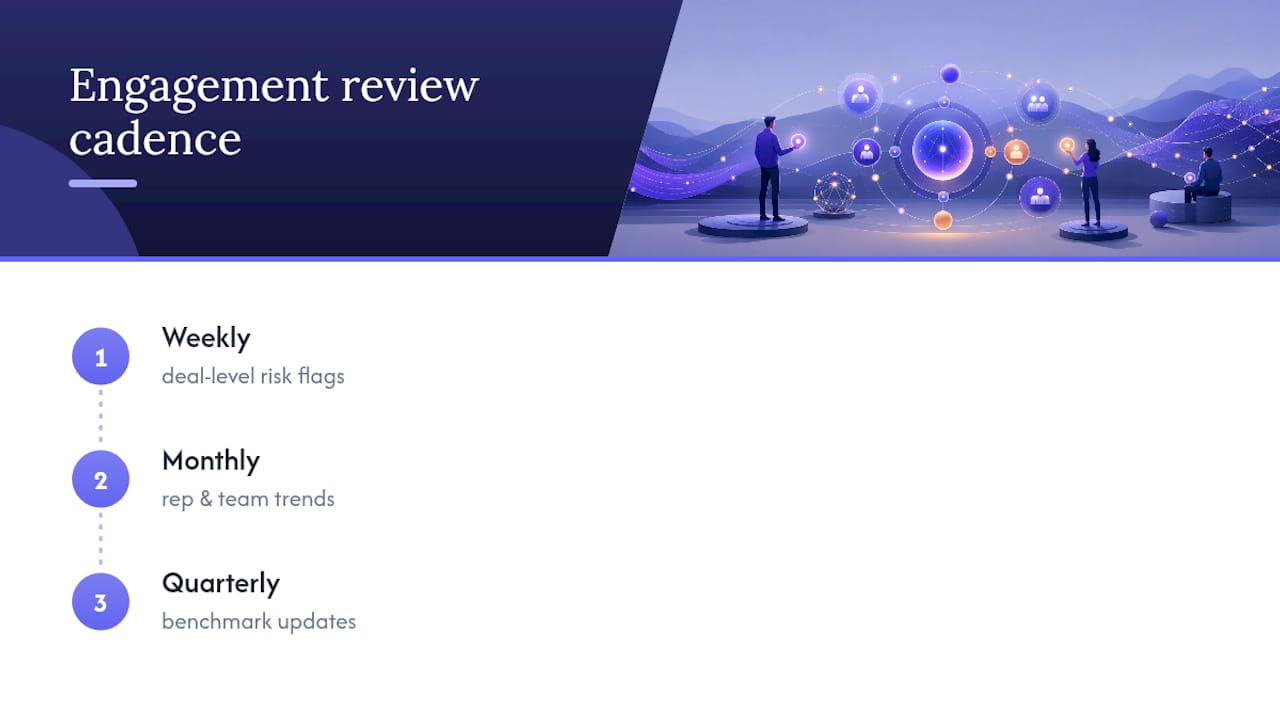
Use a layered cadence: weekly for deal-level risk flags, monthly for rep and team trends, and quarterly for benchmark updates. Reviewing everything weekly creates noise; reviewing everything quarterly means you miss deals in the process of stalling.
Which metric should a new sales manager track first?
Reply rate or call connect rate, since both are easy to measure with data you likely already have and both correlate directly with pipeline creation. Add engagement breadth once you’re comfortable with the basics.
Sources
See Salesforce, Gartner, and CaptivateIQ for deeper reading.